Coordinate Graph
The example below is Problem 1 in “Number Lines and Coordinate Graphs”.
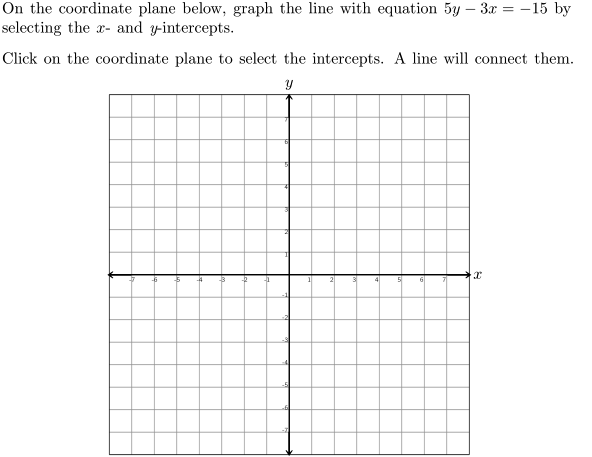
Thumbnail Preview
Example Video
Step-by-step instructions
Follow the below steps to create the above question in Problem-Attic.
-
Go to the Arrange tab and click Write New Problem.
-
In the editor, write the question and press Enter.
-
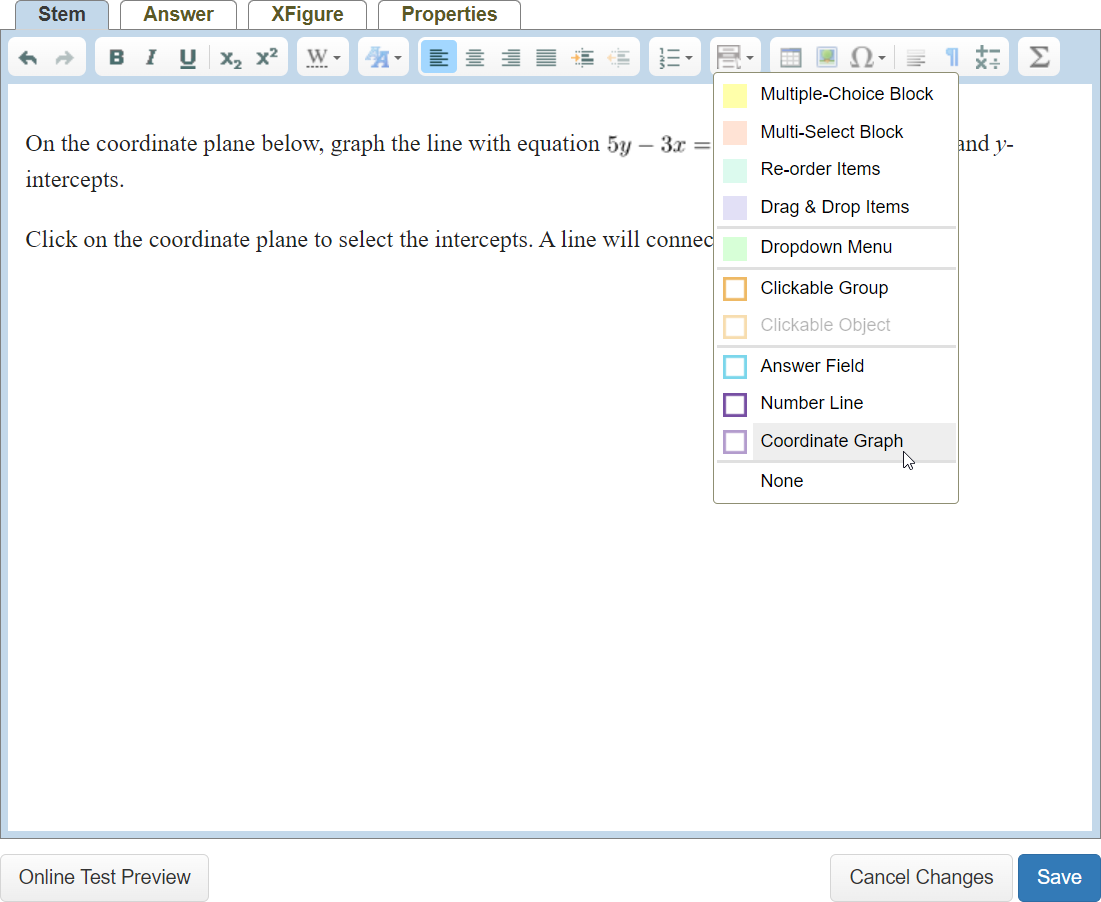
Click the Answer types menu and select Coordinate Graph.
-
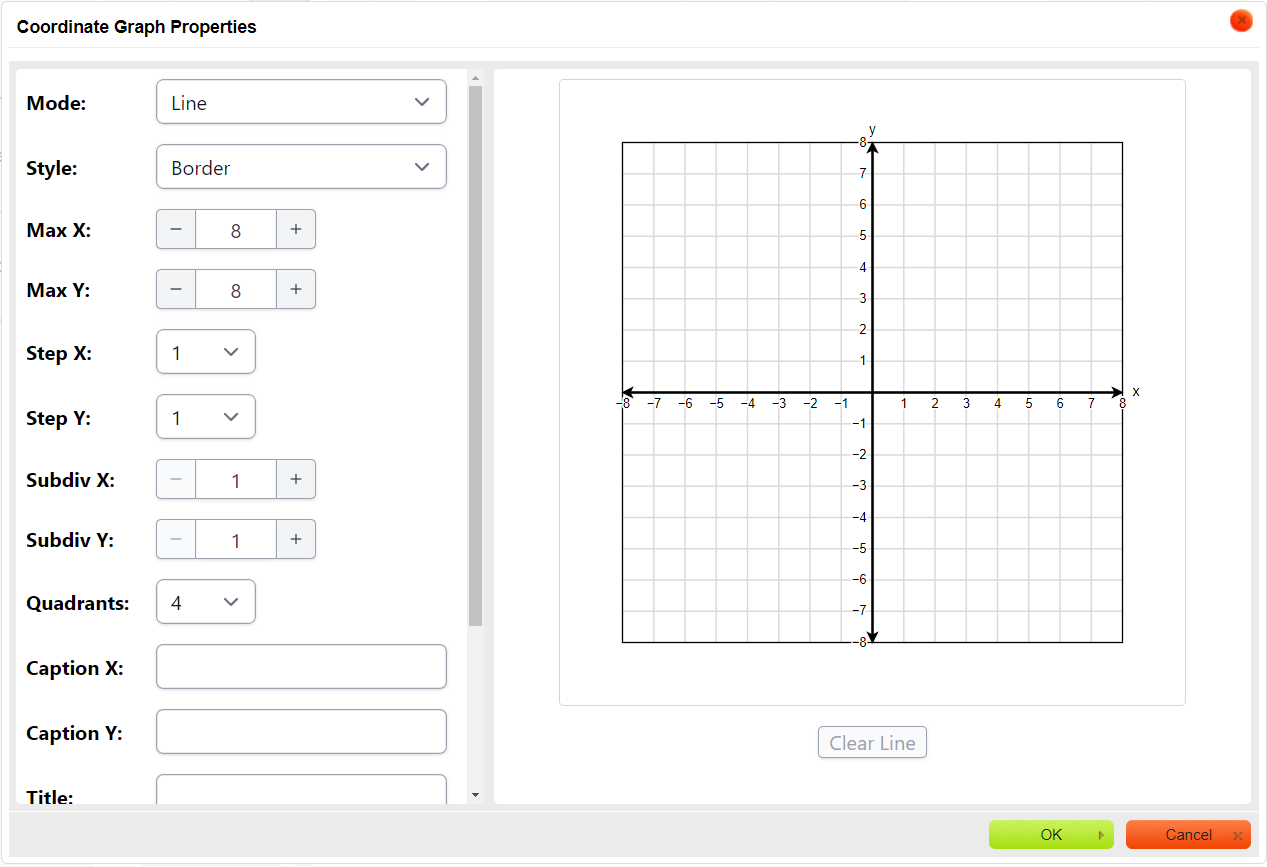
In the Coordinate Graph Properties, change the mode to Line. Choose a style, and set the maximum, step, and subdivision for both the X and Y axes. Then, choose the number of quadrants. Type a title for the graph, as well as captions and labels for the X and Y axes. Lastly, choose a print size.
-
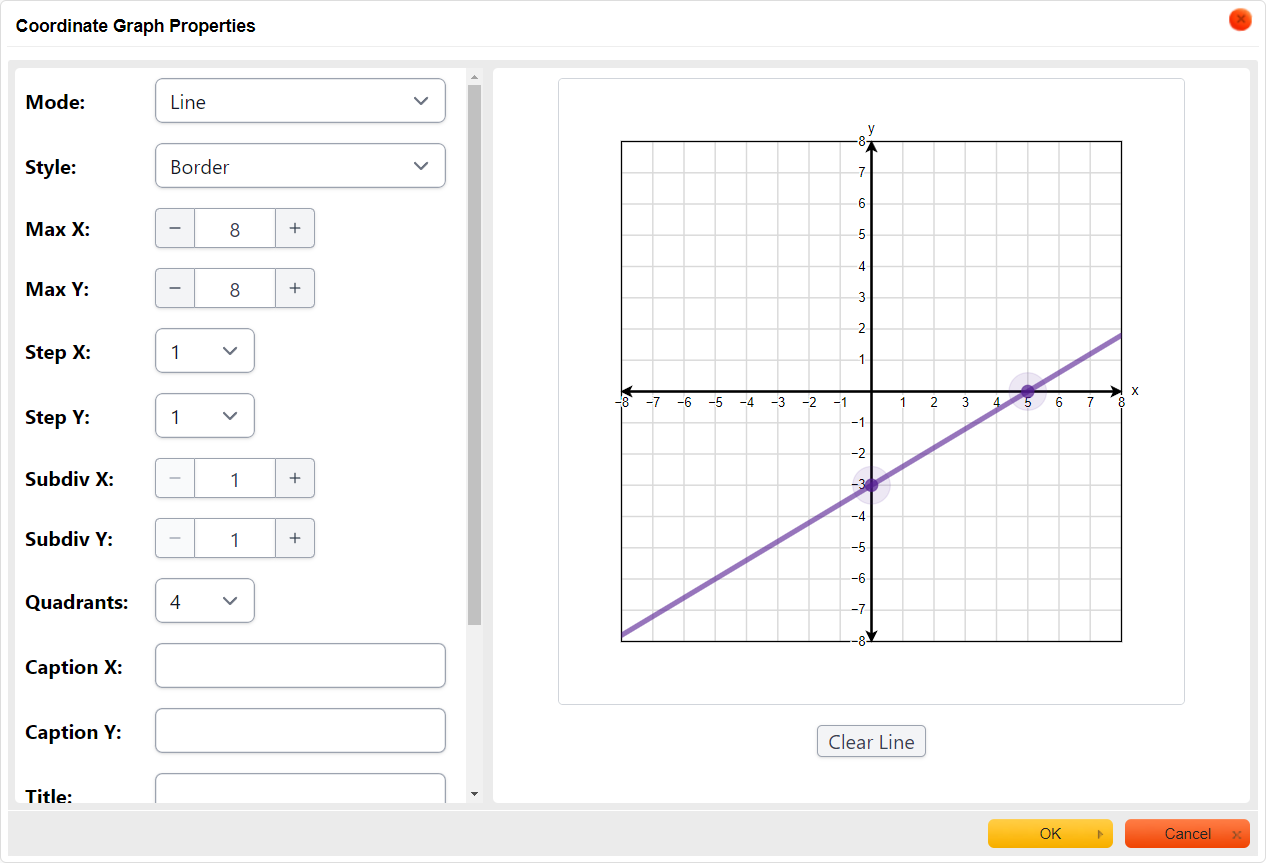
To set the answer, click on the graph to plot a point. Then click on another area on the graph to plot a second point to form a line. Click and drag the points to the correct positions.
-
Click OK in the dialog box.
-
In the editor, click Online Test Preview to see how the coordinate graph question will look and behave in an online test. When you are done, close the Preview, then then click Save.